 As e-bikes proliferate in cities around the world, there is a growing need to measure how practical an e-bike is compared to a car, and why. Julia Thomas at NREL describes research there that evaluates usefulness using the Mobility Energy Productivity (MEP) metric. The MEP quantifies the ability of an area’s transportation infrastructure — given any specific travel mode — to connect individuals to goods, services, employment opportunities, and other activities while accounting for time, cost, and energy. Though driving scores highest (the MEP does not account for emissions), e-bikes come close to matching cars in densely populated areas. That’s due to city centres having a high concentration of important destinations coupled with a well-connected network of paths — such as paths through parks — accessible to bikes and e-bikes but not cars. Note that, today, driving has an in-built (literally!) advantage over bikes, given virtually all cities are car-centric by design; think of all the existing highways, filling stations and parking, along with the urban sprawl made accessible only because of the existence of cars. E-bikes, of course, have their own advantages: they are among the smallest electric vehicles anyone can own, are much cheaper and more energy efficient, and have much lower emissions.
Do electric bikes (e-bikes) improve the overall quality of mobility for certain groups in a region? Do they provide a similar level of time-, cost-, and energy-efficient access to opportunities as cars?
To garner real-world data to answer such questions and enable in-depth evaluation of emerging transportation modes such as e-bikes, National Renewable Energy Laboratory (NREL) researchers brought together two pivotal tools: an open-source travel data collection application—the Open Platform for Agile Trip Heuristics (OpenPATH)—and a multidimensional mobility metric that quantifies the efficiency of a region’s transportation system—the Mobility Energy Productivity (MEP) metric.
Together, these tools can provide transportation practitioners and planners with timely insights into the impacts of these emerging modes to help them deliver the maximum benefits for sustainable, equitable, and efficient mobility. NREL demonstrated the integration of these tools in action to quantify the impacts of providing e-bikes to low-income essential workers in Colorado.
“Tapping into OpenPATH data from nearly 50,000 trips, MEP calculations showed that several locations in downtown Denver provided time-, cost-, and energy-efficient access to opportunities using e-bikes compared to driving,” said Christopher Hoehne, NREL mobility systems research scientist. “We also found that providing e-bikes to low-income essential workers was meaningful—they used them most frequently to commute to work, although driving was still their most frequent travel mode in general.”
NREL’s analysis results are highlighted in the “Mobility Energy Productivity and Equity: E-Bike Impacts for Low-Income Essential Workers in Denver” article authored by NREL’s Hoehne, Max Hanrahan, K. Shankari, and Venu Garikapati in the Transportation Research Record: Journal of the Transportation Research Board.
The Mobility Energy Productivity (MEP) metric
Building on accessibility theory, MEP quantifies the ability of an area’s transportation system—via any or specific travel modes—to connect individuals to goods, services, employment opportunities, and other activities while accounting for time, cost, and energy. In other words, MEP measures how efficiently connected or reachable a place is by various forms of mobility.
“Integrating MEP’s modelling capabilities with local mobility data collected via OpenPATH ensures analysis results are locally relevant,” said Shankari, an NREL director’s fellow who developed OpenPATH. “With MEP, we can generalise and expand our data collection results to explore physical infrastructure consideration, such as bike paths, that support alternative transportation modes.”

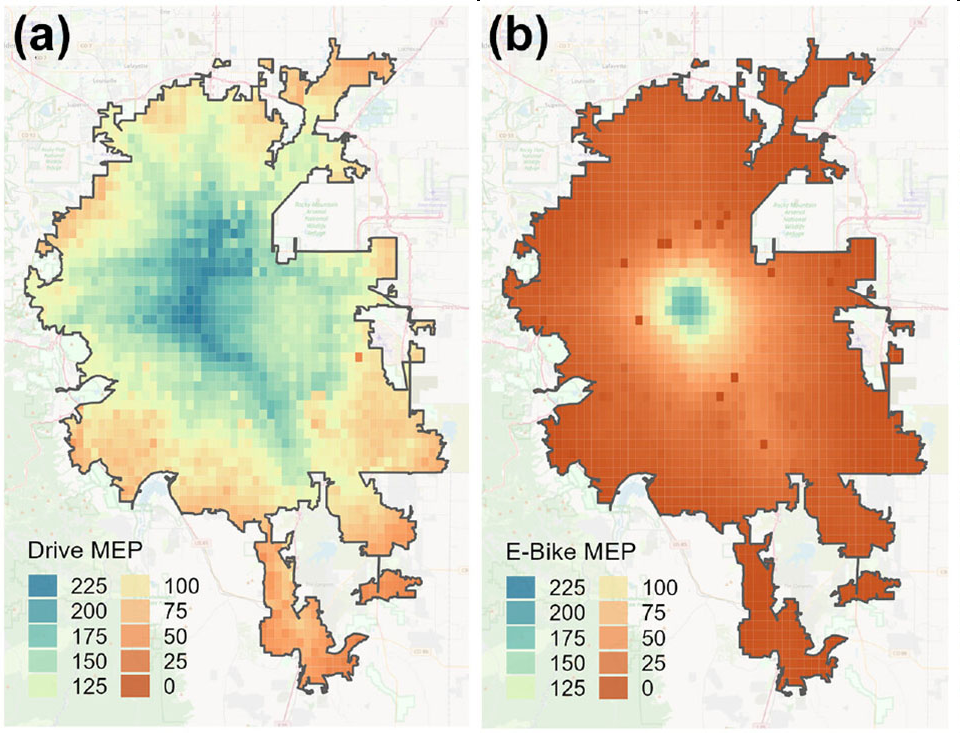
MEP scores for Denver are mapped for (a) drive and (b) e-bike modes. Each pixel is 1 km2. The highest e-bike MEP score across all locations was 178 while the highest drive MEP score was 220.
Researchers found that the overall e-bike MEP for Denver was 34, slightly more than a quarter of the drive MEP (129) but more than twice as high as the bike MEP (16) for the same region. The analysis showed that e-bikes provided twice the amount of time-, energy-, and cost-efficient access to opportunities compared to manual bikes.
The central business district
Meanwhile, the e-bike MEP was comparable in magnitude with the drive MEP in Denver’s central business district due to its high concentration of opportunities coupled with its well-connected network of paths—such as trails through parks—accessible to bikes and e-bikes but not to cars. Conversely, the lowest scores in some locations were zero MEP for walk, bike, and e-bike because of limitations in infrastructure connectivity—for example, bikes, e-bikes, and pedestrians are not permitted on highways.
“E-bikes provided the best travel alternative to driving in locations where they could be used to access opportunities at a shorter distance or duration, such as in denser neighborhoods,” said Garikapati, senior transportation data analytics researcher and MEP project leader. “The e-bike MEP was highest in downtown Denver, where the highest density of activities and jobs exist. This advantage fades away in exurbs and suburbs due to urban sprawl, where the time advantage of driving more significantly outweighs the cost and energy to access the sparser opportunity space.”
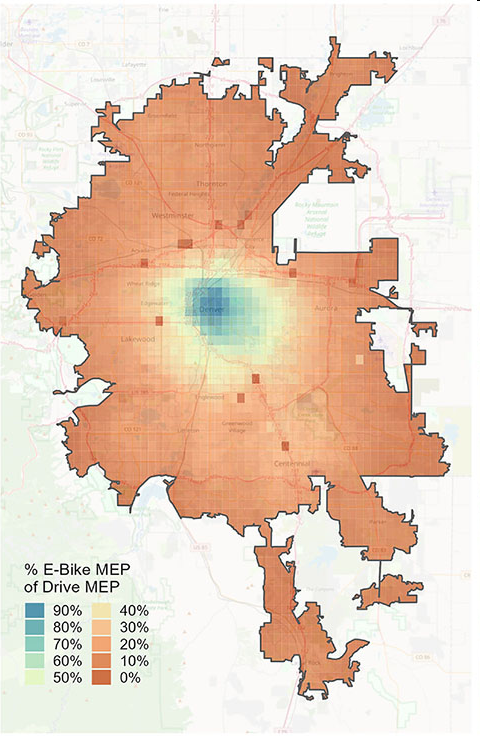
When comparing the e-bike-to-drive MEP ratio across Denver, researchers found 12 areas where the e-bike MEP was comparable in magnitude to the drive MEP, providing 80% or more of the energy-efficient access provided by a much faster mode such as driving. The location with a score most comparable in magnitude for e-bikes, providing 94% of the drive MEP, was near the Colorado State Capitol.

This map shows the ratio of e-bike MEP to drive MEP across metro Denver. A value of 50% corresponds to a location with an e-bike MEP score half the magnitude of a drive MEP score.
Density is a significant predictor
Research has shown that density is a significant predictor of urban mobility trends, with a higher number of shorter-distance trips occurring in regions with higher densities. Meanwhile, car-centric urban planning has led to large amounts of land in cities dedicated to driving and parking personal cars, and urban sprawl leads to higher amounts of driving and energy use per capita.
Spotlight on Sustainability and Equity
Vehicle electrification, coupled with a decarbonised electric grid, can play a vital role in reducing transportation-related greenhouse gases. E-bikes, which are among the smallest electric vehicles that anyone can own, are more cost and energy efficient than automobiles.
“New mobility technologies such as electrified and shared mobility, combined with supportive policies and incentive programs, can help address sustainability and equity issues in transportation planning,” Hoehne said. “While micro-mobility modes such as e-bikes are an attractive option due to their lower cost and energy use per mile than personal cars, they are best suited for shorter-distance intra-urban trips in dense areas.”
Learn more about NREL’s sustainable transportation and mobility research. And sign up for NREL’s quarterly transportation and mobility research newsletter, Sustainable Mobility Matters, to stay current on the latest news.
***
Julia Thomas is a Senior Writer at NREL
This article is published with permission from the National Renewable Energy Laboratory
